$ cd ..Back to Projects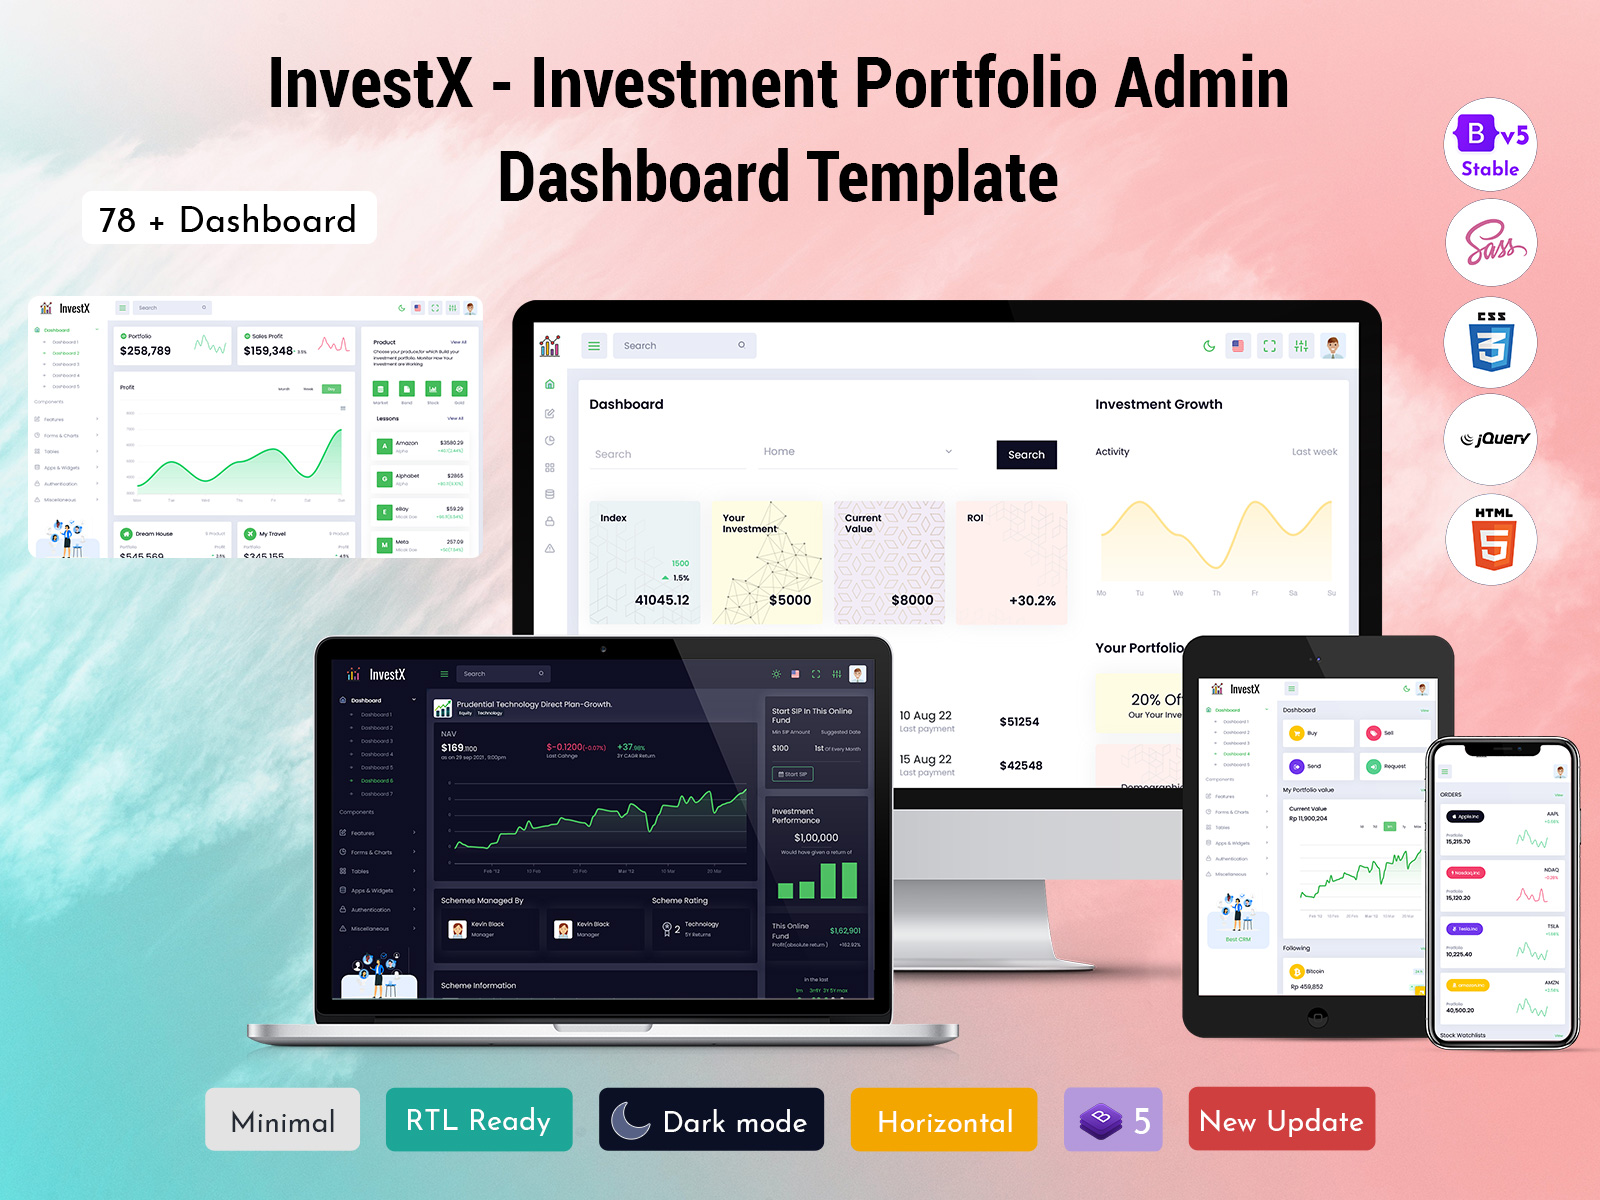
kevin@dev:~$cat portfolio-dashboard.md
Portfolio Dashboard
Interactive dashboard for tracking investment portfolios with real-time stock data, charts, and performance analytics.
Overview
Portfolio Dashboard is an interactive analytics UI for investments. It combines real-time market data with a modular widget system so users can build a view that matches their workflow.
Goal: make performance and risk obvious at a glance — without sacrificing depth.
What the user can do
- Track performance: daily/weekly/monthly returns with benchmarks
- Visualize allocation: sector split and asset breakdown
- Set alerts: price thresholds and volatility warnings
- Customize layout: widgets, ordering, and saved views
Implementation
Built with Next.js + TypeScript for strong typing and fast routing. Charts are rendered with reusable components and sensible defaults.
- Data fetching: cached API calls with graceful fallbacks
- State: predictable updates for streaming prices
- UX: responsive layout and accessible chart labels
Rich reporting
The dashboard supports narrative blocks with bold callouts, italic explanations, underlined warnings, and links to details like risk methodology and release notes.